Shipper Freight Spend Rises: Q3 U.S. Bank Freight Payment Index
After showing a glimmer of hope in Q2, the freight market lost momentum again in Q3. According to the latest U.S. Bank Freight Payment Index, shipment volumes dropped.

After showing a glimmer of hope in Q2, the freight market lost momentum again in Q3. According to the latest U.S. Bank Freight Payment Index, shipment volumes dropped 2.9% from last quarter and are now down 10.7% year-over-year. Despite that decline, spending jumped 2%, meaning shippers are paying more per load — not because of more freight, but because capacity keeps tightening.
Manufacturing Slows, Tariffs Bite
Manufacturing continues to be the biggest drag on truckload demand. Tariffs on imported goods are hurting factory output, especially since nearly half of U.S. imports are unfinished goods used for manufacturing. That ripple effect is showing up in slower industrial freight activity nationwide.
Housing also cooled off. Even with a Fed rate cut and slightly lower mortgage rates, new construction slowed again — both single-family and multi-family starts dropped compared to last quarter and last year. Add in consumers cutting back on discretionary goods (while spending less on travel too), and Q3’s freight demand picture looks increasingly sluggish.
Costs Up, Loads Down
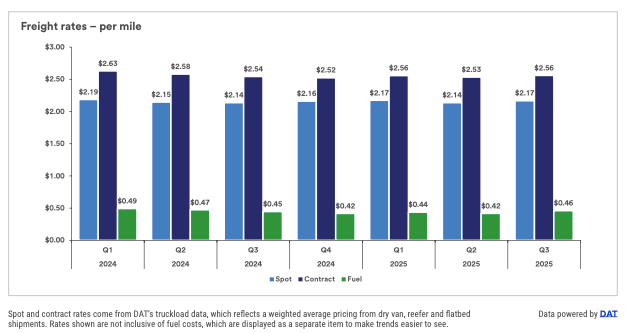
The report — paired with DAT’s Q3 data — confirms what many brokers already feel in the market: rates are inching up even as freight dries up.
- Spot rates: +1.4% (up 3¢ per mile)
- Contract rates: +1.1% (up 3¢ per mile)
- Fuel: +10.4% (up 4¢ per mile)
While fuel surcharges drove part of the increase, the bigger story is tightening supply. Smaller fleets are still exiting, and the new English Language Proficiency (ELP) enforcement — which can now put drivers out-of-service — sidelined over 5,000 drivers since late June. The result: shippers are paying more to access fewer trucks.
Regional Freight Pulse
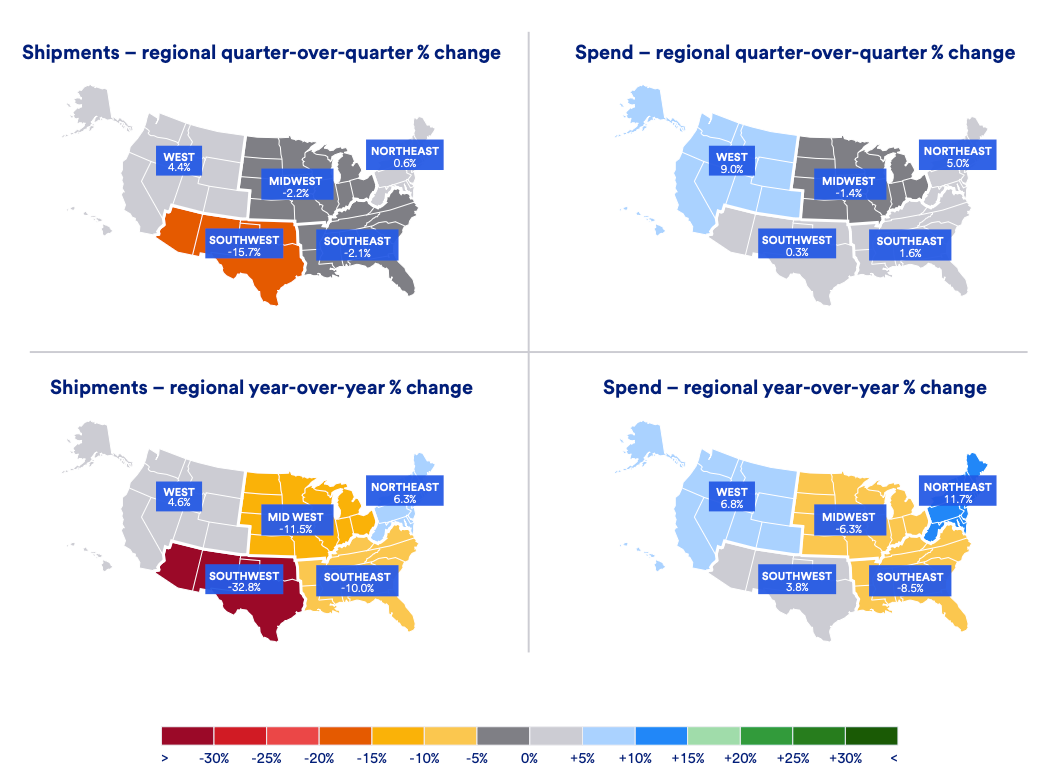
The slowdown wasn’t universal — and regional splits tell a clearer story:
- 🚢 West: +4.4% shipments / +9% spend — imports through LA & Long Beach surged as shippers rushed to beat new tariffs. It’s the region’s largest quarterly gain in four years.
- 📦 Northeast: +0.6% shipments / +5% spend — the only region to post continuous growth in both metrics this year, thanks to stronger factory and retail activity.
- ⚙️ Midwest: −2.2% shipments / −1.4% spend — manufacturing softness and muted consumer demand kept freight volumes sliding.
- 🌵 Southwest: −2.1% shipments / +0.3% spend — worst volume drop nationwide; Laredo volumes fell 6.1% YoY as cross-border freight slowed. Capacity’s tighter here too.
- 🏖 Southeast: −15.7% shipments / +1.6% spend — weak consumer spending, slower tourism, and lower manufacturing output kept the region under pressure.
Key Takeaways
The message is clear: this market’s fragile but firming. Freight volumes are still sliding, but spend is creeping higher — a classic sign of tightening supply.
This is where opportunities open up for brokers. Regional imbalances, fleet exits, and tariff-driven shifts mean some lanes are starting to swing back toward broker leverage. Watch the West and Northeast — both regions show early signs of stabilization.
It’s still survival mode for carriers, but the ELP enforcement and continued capacity attrition could finally lift rates into 2026. Fuel costs and compliance will sting, but with fewer trucks on the road, pricing power might be inching back your way. If Q4 continues this pattern — less freight, but higher spend — the bottom of the cycle might already be in the rearview.